Why the next revolution in personal health tracking isn’t yet another app, app update or new device — it could be no device at all.We keep moving our data closer to ourselves. Once, information lived on mainframes. Then it moved to
personal computers, then to phones, and sometimes even to smart watches.
Every step reduced friction — less distance between us and the tools
that capture what we do. But even watches don’t fully solve the problem — you still have to initiate the measurement or record the data manually. It gives us more and more freedom: entry at the origin of the measurement, rather than noting and entry later. People can suggest adding fields to existing health apps: That might happen, but unless it can be viewed in relation to other measurements, something many apps still can't do, it is not ideal. A better approach might be to record those values alongside other data in Excel, or temporarily or permanently in Google Sheets, whichever is easiest at the moment. That way, you own the data and can use it however you like. But this points to something larger: our constant push to make data capture quicker, easier, and closer to us. We used to need large computers and cables; now we tap a screen on our phone/tablet or wrist. What comes after this? 1. The pattern of proximityEvery generation of computing has tended to shift toward immediacy, where each device is more readily available and quicker to access:
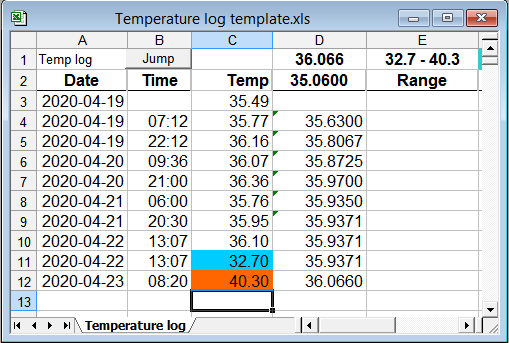
The pattern is clear: not more capability, but less distance between the user and the measurement. We are always trying to reduce the number of steps between observation and record. 2. The current limitationToday, I might take my temperature manually, record it on my phone, and later import it into Excel to look for trends or correlations with other data. The process is digital, but not yet automatic. 2a. Example: Simple Temperature Log
|
|
Desktop Excel:
|
Google Sheets usage:
|
|
Download the desktop Excel template: |
Copy the Google Sheet template version |
To make real use of the template
Lines 4 and on can be deleted
Make the first entry on line 3 manually
then subsequent entries on line 4 and on
For the sake of clarity, here’s how I use the term Internet 4 in context:
- Internet 1 — When separate networks became interconnected, primarily to enable email.
- Internet 2 — The World Wide Web era, when documents and data could be searched and shared globally.
- Internet 3 — The conversational era, marked by systems like ChatGPT and other AI that allow natural interaction.
- Internet 4 — The coming robot era: a deviceless, ambient internet that interacts with humans more directly, where sensors, automation, and intelligence blend into daily life without other visible devices.
4. The next logical step — Internet 4
What could come after the smartphone and smartwatch era. The likely answer is not another smaller gadget but an ambulant or deviceless system — what I call Internet 4.
In that model, any additional measurements that are made could be captured automatically. A household robot could read a thermometer, recognise who it belongs to, and log the result directly into a spreadsheet. No taps, no syncing, no Bluetooth failures — just observation and record.
Data becomes continuous and self-maintaining.
5. When devices disappear
The next revolution won’t be a new model or update. It will be the quiet vanishing of the manual interface. The line between measurement and data storage will dissolve.
Our devices won’t compete for attention because we won’t need to handle them at all.
At that point, “recording” will no longer mean doing anything. The data will simply exist, ready for analysis.
This situation may be some 10-15 years away before robots become more common place but it may well creep up on us unexpectedly in some ways as AI has.
6. Closing reflection
The goal of technology was never more screens or sensors — it was less effort, automatic capture where possible.
As we approach the era of ambient measurement, perhaps the most radical innovation will be absence: the disappearance of the device itself.
When all your health data updates itself, what will you do with the time you get back?
Perhaps we’ll finally spend less time managing data — and more time living.